Ages of Top Male and Female Money-Making Actors: 1932 to 2012
Kathleen M. Silva, PhD and Francisco J. Silva, PhD
University of Redlands
Abstract
This study examined the ages of the Quigley Poll’s top money-making male and female actors between the years 1932 and 2012. The mean ages of the top male and female actors were 41.1 and 31.9 years, respectively, and there were no systematic changes in these means across the eight decades of the Poll. These mean ages were similar to the ideal ages of men’s and women’s preferred romantic partners that have been reported in studies of mate preferences (women aged 20 – 69 years prefer, on average, a 43-yr old partner; men of the same ages prefer, on average a 34-yr old partner). These results suggest an intriguing hypothesis: In general, the top money-making actors may be so because they activate evolved processes related to mate selection.
 Kathleen M. Silva earned her PhD from Indiana University. She is currently an Associate Professor of Psychology at the University of Redlands. Her research interests include the study of how people’s musical preferences can be influenced by procedures rooted in learning theory and social psychology. Her articles have appeared in Learning and Motivation, Behavioural Processes, Teaching of Psychology, and Psychology of Music. kathleen_silva@redlands.edu
 Francisco J. Silva earned his PhD from the University of Manitoba. He is currently a Professor of Psychology at the University of Redlands. His research interests include the study of what humans understand about physical causality. His articles have appeared in American Psychologist, Journal of the Experimental Analysis of Behavior, Learning & Behavior, and Psychonomic Bulletin & Review.francisco_silva@redlands.edu
Correspondence concerning this article should be addressed to Kathleen Silva, Department of Psychology, University of Redlands, P.O. Box 3080, 1200 East Colton Avenue, Redlands, California 92373 USA (Email: kathleen_silva@redlands.edu).
People are attracted to other people for many reasons, such as because someone is familiar to us (Zajonc, 1968), similar to us in terms of their age, religion, intelligence, education, and political beliefs (e.g., Alford, Hatemi, Hibbing, Martin, & Eaves, 2011), and physically attractive (Finkel & Eastwick, 2008; Walster, Aronson, Abrahams, & Rottman, 1966). These variables – familiarity, similarity, and physical appearance – influence whom we believe, vote for, befriend, date, and marry (Cialdini, 2008). Another of our actions that may be influenced by a person’s attractiveness is movie watching.
Although a film may succeed for reasons other than the appeal of its actors, different actors are differentially associated with box-office success. To measure an actor’s appeal, the Quigley Publishing Company publishes an annual poll of motion picture exhibitors. The Quigley Poll, as it is commonly referred to, has been published every year since 1932 and consists of a survey that asks motion picture theatre owners and film buyers to vote for the ten actors that they think generated the most box-office revenue for their theatres during the year. Significantly, the poll asks voters to distinguish between actors who appear in a film versus those who were responsible for attracting an audience to the film. In this regard, the Quigley Poll attempts to measure an actor’s appeal or attractiveness.
Exactly what attracts an audience to an actor is unclear. It could be a multitude of variables, many of which are difficult to operationally define and measure (e.g., how much an audience identifies with the character played by an actor, how much an audience admires the leadership of the character portrayed by an actor, or an actor’s acting abilities). In contrast, a variable that is easy to quantify and may affect an actor’s attractiveness is his or her age.
In this study, we used examined the Quigley Poll’s top money-making male and female actors for the years 1932 to 2102 to address four questions:
- What were the ages of the top money-making male and female actors at the end of the year that they were voted the top money-maker?
- Was there a difference in the ages of the top money-making male versus female actors?
- Did the ages of the top money-making male and female actors change across the decades?
- Might the answers to the preceding questions tell us something about why audiences are attracted to different actors?
Method
Procedure
Data collection began by noting the top money-making male and female actors for each year between 1932 and 2012 published in Quigley Publishing Company’s International Motion Picture Almanac (http://www.quigleypublishing.com). The actors’ ages at the end of the year in which they were the top actor were obtained from the Internet Movie Database (IMDb) (http://www.imdb.com).
This resulting data consisted of 81 male actors, but only 78 female actors. This difference in the number of males and females occurred because the Quigley Poll yields the top ten money-making actors of a given year. In three years (1957, 1983, 2007), no female actors made the list. In addition, there were two years (1942, 1952) in which there was a tie for the top money-making male actor. For both of these years, the ages of the actors were averaged to produce a single age for each year.
Data Analysis
The fact that some actors were the top money-making actor in multiple years made the use of classical inferential statistics problematic. For this reason, we assessed whether there were statistical differences between the ages of the top-money making male and female actors using a resampling method (randomization test). The randomization test shuffled the data and randomly assigned each value to one of two conditions, each of which likely contained male and female actors’ data, but could have contained exclusively male or female actors and thus would have been identical to the original dataset. The mean difference between the two conditions was calculated, and then this shuffling and random assignment to two conditions was repeated 10,000 times. To determine the likelihood that the difference between the mean age of male and female actors occurred by chance, we noted how often the randomized data produced a mean difference that was more extreme (two-tailed) than the actual mean difference between the male and female actors’ ages, n. If this proportion (p = n / 10,000) was less than .05, we concluded that it was unlikely that our results were obtained by chance and thus were statistically significant.
Results
Figure 1 shows the ages of the top money-making male and female actors between 1932 and 2012. The youngest and oldest females on an annual list were Shirley Temple (age = 7 yrs in 1935) and Marie Dressler (age = 65 yrs in 1933), respectively. The youngest male actor on an annual list was Mickey Rooney (age = 19 yrs in 1939) and the oldest male actor was John Wayne (age = 64 yrs in 1971). Three of these four highest-lowest ages occurred in the 1930s, the first decade of the Quigley Poll.
Figure 1. Ages of the top money-making male and female actors between 1932 and 2012. The dashed red line between the years 1956-1958, 1982-1984, and 2006-2008 indicate that no female actor was voted to the top ten money-making list for the years 1957, 1983, and 2007.
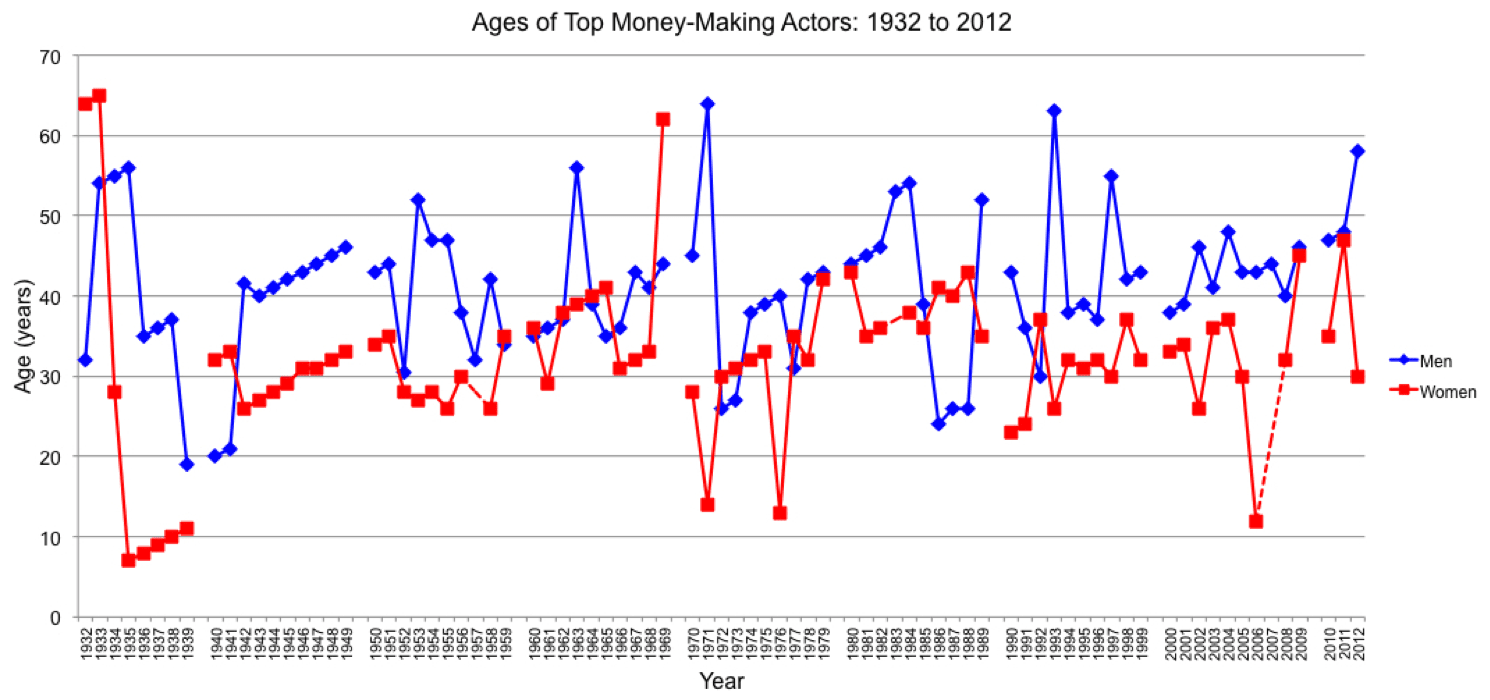
The following features are worth noting. First, linear increases in age across several years occurred when an actor was the top money-maker in successive years (e.g., Shirley Temple in the 1930s, Bing Crosby and Betty Grable in the 1940s, Barbara Streisand in the 1970s, Burt Reynolds in the late 1970s and early 1980s). Second, there was no systematic trend across the decades; small increments in the ages of the actors were followed by larger abrupt decrements. Third, the top money-making female actor was consistently younger than the top male actor (Mfemales = 31.9 yrs, SD = 10.6; Mmales = 41.1 yrs, SD = 9.1).
Figure 2 shows the relative frequency distributions of the top money-making male and female actors. Consistent with Figure 1, the distributions show that women in their 30s and men in their 40s were most often the top money-making actors. In fact, female actors in their 30s were the top money-makers in more than half of the years. In contrast, the male actors’ distribution is less peaked than the females’ distribution. The top money-making male actor was often in his 30s, and male actors 50 or older were the top money-maker 12 times in 81 years. Women who were 50 or older were the top money-making female actor only 3 times in 78 years.
Figure 2. Relative frequency distributions of the data shown in Figure 1.
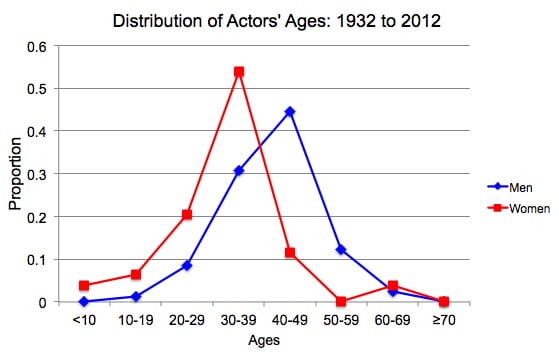
Figure 2 also shows that the greatest difference between how often men of a particular age and women of the same age were the top money-making actors occurred when actors were in their 40s. Whereas men in their 40s were the top money-makers 36 of 81 years, only in 9 of 78 years was a women in her 40s the top money-making female, a difference of 74%. It may be noteworthy that the most abrupt change between adjacent age-bins occurred between the modal bin (30 – 39 yrs for women; 40 – 49 yrs for men) and the subsequent bin (40 – 49 yrs for women; 50 – 59 yrs for men). In other words, the probability of being the top money-making actor decreased most abruptly immediately after the age range associated with the highest probability of being a top money-making actor.
Randomization tests of the male and female actors’ ages failed to produce two distributions whose absolute mean difference was equal to or greater than the mean difference of the data (Mdiff = 9.2 yrs). The computed probability of obtaining the results shown in Figures 1 and 2 by chance was 0/10,000 or p = 0.0; thus, the obtained results were statistically significant.
Discussion
The purpose of this study was to examine the Quigley Poll’s top money-making male and female actors for the years 1932 to 2012. To the extent that this poll measures an actor’s ability to attract an audience to a film, we can answer the following questions: (1) What were the ages of the top money-making male and female actors? (2) Was there a difference in the ages of these two groups of actors? (3) Have the ages of the top money-making actors changed across the decades? The answers to these questions can be summarized as follows: The mean ages of the top male and female actors were 41.1 and 31.9 years, respectively, and there were no systematic changes in these means across the eight decades of the Quigley Poll.
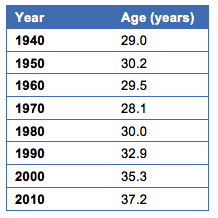
A more challenging task is to explain the results and to speculate about what role an actor’s age plays in his or her ability to attract an audience. We begin with some information about the age of America’s population between 1940 and 2010 (see Table 1). In contrast to the stability of the mean ages of the top male and female actors, the median age of America’s population has increased since 1970. The increasing age of America’s population has not translated into an increase in the ages of the top money-making actors.
Table 1: Median Age of People in the United States (1940 to 2010)Source: Decennial Census, United States Census Bureau
In terms of who goes to the movies, the Motion Picture Association of America (MPAA) (2013) reported that 50% of the people who purchased movie tickets in the United States and Canada in 2012 were women and 50% were men. Moviegoers aged 25 to 39 years bought the most tickets (24%) followed by 18- to 24-year olds (19%). According to Screenvision (2013), a cinema advertising company in the United States, the median age of moviegoers in the United States is 30.5 years and 51% of its audience is aged 18 to 49 years. Although the mean age of the top money-making female actors (31.9 yrs) falls within the age demographic that the MPAA (2103) and Screenvision (2013) report most often goes to the movies, the mean age of the top money-making male actors (41.1 yrs) falls outside the MPAA’s 25- to 39-years range.
Given that the mean ages of the top money-making male and female actors were within or just outside age demographics that comprise most moviegoers, it could be that audiences are simply attracted to actors who seem to be like them, at least in terms of age. For two reasons, though, this explanation is unsatisfactory. First, finding that the mean ages of the top money-making actors fall within a broad age demographic (25 to 39 yrs or 18 to 49 yrs) is a bit like hitting a golf ball off a pier into the ocean – i.e., the probability of hitting the target was high. Second, the fact that the mean ages of the top money-making actors fall within the age demographic that most frequently goes to the movies does not explain why across the eight decades of the Quigley Poll the top money-making male actor was consistently older than the top money-making female actor, a result that continued with the release of the 2013 Quigley Poll. The ages of top money-making male and female actors for 2013 were 38 years (Bradley Cooper) and 23 years (Jennifer Lawrence), respectively.
To explain this difference, we examine a dimension of attraction where men are generally older than women: mate selection. As expressed in cross-cultural surveys (Buss, 1989), online dating services and newspaper advertisements (Gustavsson, Johnsson, & Uller, 2008), popular magazine surveys (Pergament, 2013), and the ages of American men and women when they first marry (Elliott, Krivickas, Brault, & Kreider, 2012), women prefer older partners and men prefer younger partners. This pattern is so consistent across many cultures that researchers believe this result reflects evolutionarily selected tendencies rather than societal sex-role norms (Kenrick, Keefe, Gabrielidis, & Cornelius, 1996; but see Burrows, 2013). Men supposedly prefer younger women because these females have higher reproductive value and fecundity. Women supposedly prefer older men because these males have more material resources and higher social status (Kenrick, 2011). One exception to this pattern is that male teenagers (12 to 18 yrs) say that their ideal dating partner would be several years older than themselves. Once men reach their 30s, though, they tend to prefer partners slightly younger than themselves, a preference that becomes more pronounced as men age. For example, men in their 60s generally prefer women about 5 to 15 years younger than themselves (Kenrick & Keefe, 1992).
Based on research of men and women of different ages’ (20s through 60s) preferences for the age of their partner as expressed in adult advertisements, the mean age of men’s preferred partner is about 34 years old. The mean age of women’s preferred partner is about 43 years old (see Kenrick et al., 1996, Fig 1).[1] The mean difference between the men’s and the women’s preferred age of their partners is 9 years. The similarity of these means (i.e., women aged 20 – 69 prefer, on average, a 43-yr old partner; men of the same ages prefer, on average, a 34-yr old partner) and the mean difference (9 yrs) to the mean ages of the top money-making male (41.1 yrs) and female (31.9 yrs) actors and their mean differences (9.2 yrs) is notable.
The preceding results are suggestive. They are either a remarkable coincidence or the product of unidentified variables. Movie audiences are a diverse population of various ages, races, ethnicities, religions, sexual orientations, socioeconomic statuses, intelligences, and many other demographics (see e.g., Nielsen National Research Group, 2013). It may be unreasonable to think that someone was a top money-making actor because she or he activated an unconscious, evolved mechanism related to mate selection in a large percentage of moviegoers. It could be, for example, that movie audiences are attracted to certain actors not because of anything to do with mate selection, but because of something related to leadership, humor, empathy, or acting ability. Or perhaps the reason why female actors in their 30s and male actors in their 40s are most often the top money-makers is because these are the people who are offered the best scripts, most money, and largest promotional campaigns. None of these possible reasons, though, excludes attractiveness related to mate selection as an underlying influence. For example, studio executives may offer the best scripts and the most money to female actors in their 30s and to male actors in their 40s because audiences find these people physically attractive. Indeed, a survey of 2,000 people in the United States commissioned by Allure magazine (2013, April) found that women are considered most beautiful at age 30 and start to show signs of aging at 41. In contrast, men are most physically attractive at age 34 and start to show signs of aging at 43. Although the “most beautiful at” age for the women is similar to the mean age of the top money-making female actors, the age for the men is lower than the mean age of the top money-making male actors.
To get a better sense of whether the similarity in the ages of the top money-making actors and those of men and women’s age preferences for romantic partners was a coincidence, we evaluated another hypothesis: Might the differences in the ages of the top money-making male and female actors be related to leadership or problem-solving skills instead of mate selection? Actors often portray characters who are leaders. Even when not explicitly playing the role of a leader, many characters face challenges that they resolve by the end of the movie. Politicians are a group of men and women leaders who are elected to solve problems. How do the ages of men and women politicians compare with the ages of the top money-making male and female actors? To answer this question, we examined the ages of the 80 men and 20 women who are the Senators of the 113th Congress (i.e., the 2013 membership of the United States Senate).
Figure 3 shows the proportion of Senators who fall into the same age-bins used for constructing the frequency distributions of the top money-making actors. The top panel shows the ages of the Senators by the end of 2013; the bottom panel shows the Senators’ ages when they were first elected. The top panel shows that the largest proportion of male and female Senators are in their 60s, but that many are in their 50s and over 70 years old. There does not appear to be any age differences between male and female Senators. Although it is not ideal to conduct statistical analyses with samples of such disparate sizes (80 male Senators vs. 20 female Senators), a randomization test of the male and female Senators’ ages supported the interpretation that these groups did not differ statistically (p = .34). Thus, it does not appear that voters predominantly supported male Senators of one age and female Senators of another age.
Figure 3. Relative frequency distributions of the ages of the Senators of the 113th Congress. The top panel shows the Senators’ ages at the end of 2013; the bottom panel shows the Senators’ ages when they were first elected.
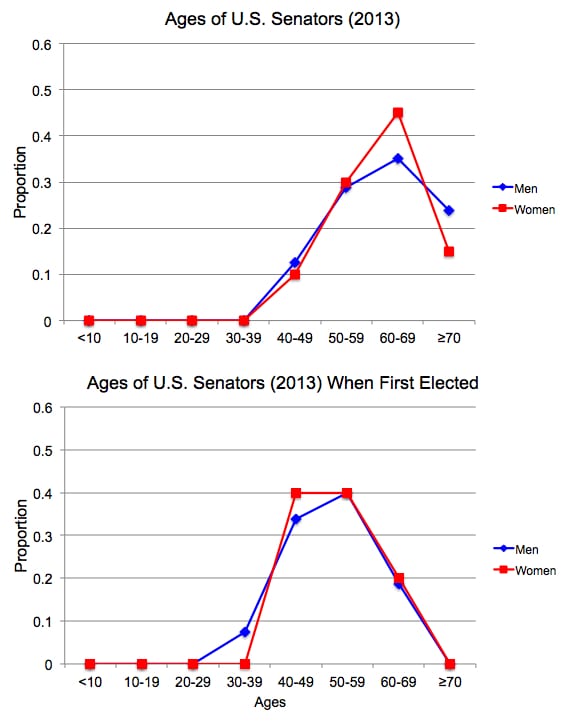 The same was true of the ages of the Senators when they were first elected (bottom panel of Figure 3). There does not appear to be an overall difference between the ages of the male and female Senators, a result supported by a randomization test (p = .44). Moreover, the mean age of the male Senators when they were first elected was 51.3 years, about 10 years older than the mean age of the top money-making male actors (randomization test, p = 0.0). Similarly, the mean age of the female Senators when they were first elected was 51 years, about 20 years older than mean age of the top money-making female actors (randomization test, p = 0.0).
The analyses of the Senators ages show that, in contrast with the ages of the top money-making male and female actors, there was no difference in the ages of the male and female Senators. In addition, both male and female Senators were significantly older when they were elected than the top money-making male and female actors. Together, these results suggest that whatever is responsible for the difference in the mean ages of the top money-making male and female actors, it is unlikely to be “leadership” or “problem solving skills.” Overall, the results are most consistent with a view that the top money-making actors may be so because they often activate unconscious evolved processes and mechanisms in moviegoers related to mate selection.
References
Alford, J. R., Hatemi, P. K., Hibbing, J. R., Martin, N. G., & Eaves, L. J. (2011). The politics of mate choice. Journal of Politics, 73, 362-379. doi:10.1017/S0022381611000016
Pergament, D. (2013, April). The Allure aging survey. Allure, 228.
Burrows, K. (2013). Age preferences in dating advertisements by homosexuals and heterosexuals: From sociobiological to sociological explanations. Archives of Sexual Behavior, 42, 203-211. doi: 10.1007/s10508-012-0031-7
Buss, D. M. (1989). Sex differences in human mate preferences: Evolutionary hypotheses tested in 37 cultures. Behavioral and Brain Sciences, 12, 1-49. doi: 10.1017/S0140525X00023992
Cialdini, R. B. (2008). Influence: Science and practice (5th ed.). Englewood Cliffs, USA: Pearson.
Elliott, D. B., Krivickas, K., Brault, M. W., & Kreider, R. M. (2012). Historical marriage trends from 1890-2010: A focus on race differences. (SEHSD Working Paper Number 2012-12). Retrieved September 15, 2013 from U.S. Census Bureau website http://www.census.gov/hhes/socdemo/marriage/data/census/ElliottetalPAA2012paper.pdf
Finkel, E. J., & Eastwick, P. W. (2008). Speed-dating. Current Directions in Psychological Science, 17, 193-197. doi: 10.1111/j.1467-8721.2008.00573.x
Gustavsson, L., Johnsson, J. I., & Uller, T. (2008). Mixed support for sexual selection theories of mate preferences in the Swedish population. Evolutionary Psychology, 6, 575-585.
Kenrick, D. T. (2011). Sex, murder, and the meaning of life: A psychologist investigates how evolution, cognition, and complexity are revolutionizing our view of human nature. New York, USA: Basic Books.
Kenrick, D. T. & Keefe, R. C. (1992). Age preferences in mates reflect sex differences in human reproductive strategies. Behavioral and Brain Sciences, 15, 75-133. doi: 10.1017/S0140525X00067595
Kenrick, D. T., Keefe, R. C., Gabrielidis, C., & Cornelius, J. S. (1996). Adolescents’ age preferences for dating partners: Support for an evolutionary model of life-history strategies. Child Development, 67, 1499-1511. doi: 10.2307/1131714
Motion Picture Association of America (2013). Theatrical market statistics 2012. Retrieved September 15, 2013, from http://www.mpaa.org/Resources/3037b7a4-58a2-4109-8012-58fca3abdf1b.pdf
Nielson National Research Group (2013). Popcorn people: Profiles of the U.S. moviegoer audience. Retrieved September 15, 2013, from http://www.nielsen.com/us/en/newswire/2013/popcorn-people-profiles-of-the-u-s-moviegoer-audience.html
Rohatgi, A. (2012). WebPlotDigitizer (v. 2.5). Retrieved September 15, 2013 from http://arohatgi.info/WebPlotDigitizer/
Screenvision (2013). Retrieved September 15, 2013 from http://www.screenvision.com/why-cinema/cinema-facts/
Walster, E., Aronson, E., Abrahams, D., & Rottman, L. (1966). Importance of physical attractiveness in dating behavior. Journal of Personality and Social Psychology, 4. 508-516. doi: 10.1037/h0021188
Zajonc, R. B. (1968). Attitudinal effects of mere exposure. Journal of Personality and Social Psychology, 9 (Monograph Suppl. 2, Pt. 2). doi: 10.1037/h0025848
[1] These ages were obtained using WebPlotDigitizer (Rohatgi, 2012) to extract the numerical data from the graph in Figure 1 of Kenrick et al. (1996) and then averaging across the aforementioned age groups of men’s and women’s preferences for their youngest and oldest partners.